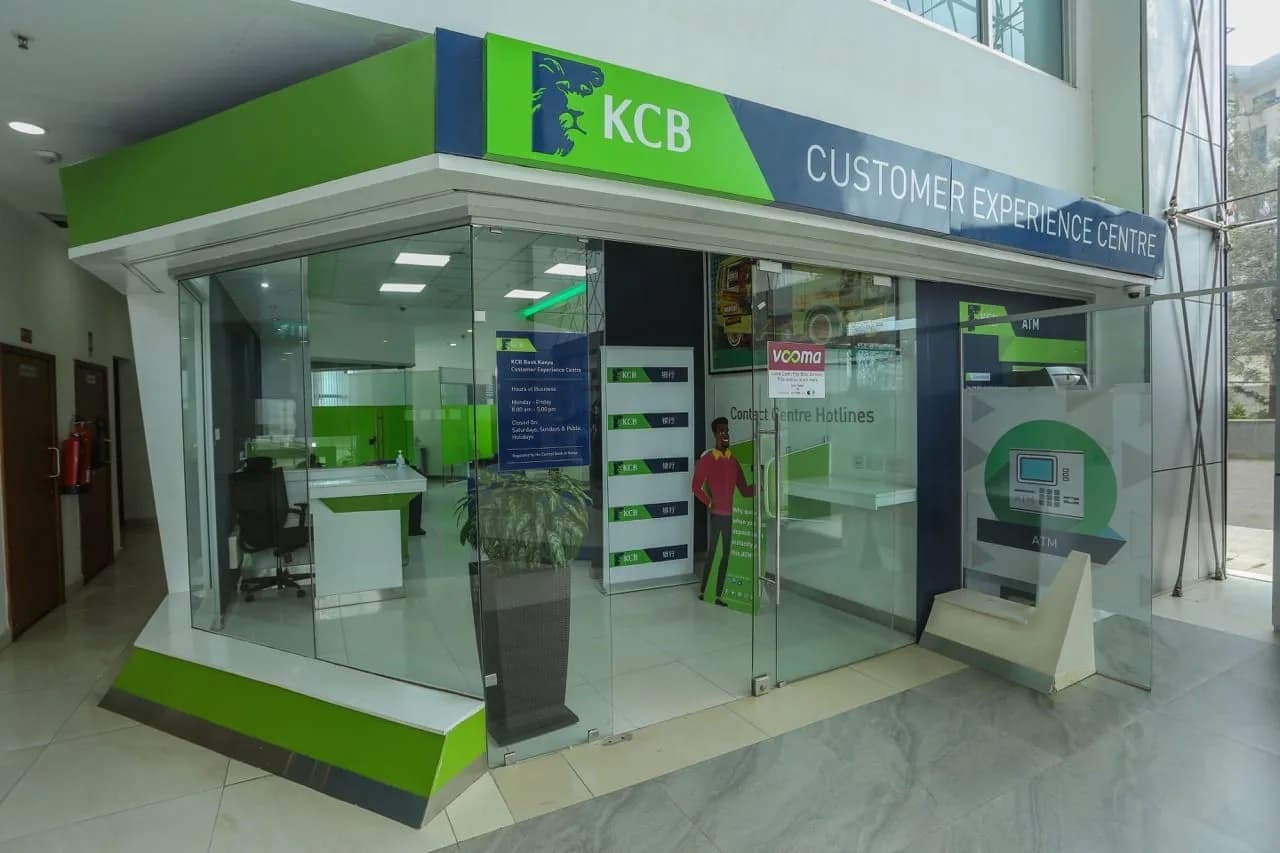
KCB Bank Kenya widened its lead over Equity Bank Kenya to 5.5 percentage points in 2025 — the widest gap in CBK’s market-size series since at least 2012.
KCB’s weighted market share rose to 17.3% from 16.6%, while Equity’s declined to 11.8% from 12.8%.
The contrast is even more striking when viewed from 2021. The two banks were almost neck-and-neck then, with KCB at 13.81% and Equity at 13.57% — just 0.24 percentage points apart.
By 2025, the lender had gained 3.49 percentage points, while Equity had lost 1.77 points.
This has been accompanied by a significant difference in balance-sheet growth:
– KCB net assets: KSh826B → KSh1.50Trillion
– Equity net assets: KSh877B → KSh1.04Trillion
– KCB deposits: KSh1.15Trillion
– Equity deposits: KSh849Billion
What KCB Growth means for Investors
This is more than a change in ranking. The lender has materially expanded its balance-sheet scale over Equity since 2021, while Equity’s growth has been comparatively slower.
The interesting question for investors is whether KCB can sustain this expansion while maintaining asset quality, profitability and returns on capital — and whether Equity can regain the balance-sheet momentum that previously kept it much closer to KCB.
2021: almost tied.
2025: a 5.5-point gap.
That is a meaningful shift in Kenya’s banking landscape.
With the new regulations coming up by CBK on dividend payout, analysts maintain that these two lenders should now pay us at least 80% of their profits.
KCB Group Plc is a registered non-operating holding company that oversees KCB Bank Kenya, and all the regional subsidiaries.
It also owns KCB Bancassurance Intermediary limited, KCB Investment Bank, KCB Corporate Trustee, KCB Foundation and other associate companies.
The Group has an asset base of KSh 2.3 trillion, the largest branch network in the region with 460 branches, 1,247 ATMs, 1.4 million bank and Vooma merchants and agents offering banking services on a 24/7 basis in East Africa.

Comments
No comments yet. Be the first to share your thoughts.